
STAT-001 To verify
448 of 2,257facts
checkable facts that Italian members of parliament said in public that were false or half-false (19.8%)
Italy · 86 members of parliament · 62,918 statements
Working paper Original source ↗
Many people say all politicians lie. We looked for studies that count what politicians say and tests of their honesty. We also checked their promises, in as many countries as we could find.
True.
In Italy, 448 of 2,257 checkable facts that 86 members of parliament said in public were false or half-false. That is about 1 in 5. But politicians keep more of their promises than most people think.
In short. Yes. About 1 in 5 checkable facts stated by Italian members of parliament were false or half-false. Many Spanish mayors lied in a simple coin-flip test. But politicians keep more promises than most people think.
60%. Robert Thomson and his team found that parties in government kept 60% of 9,133 promises at least in part. In the UK, where one party usually rules alone, it was 86%. SRC-THOMSON2017
Each figure with its source, period and what it measures.
448 of 2,257facts
Italy · 86 members of parliament · 62,918 statements
60%
12 countries in Europe and North America, 57 elections, 1974–2016
About 68%
Spain · survey game
31 of 33countries
International survey (ISSP) from 2006, as reported by Thomson et al. 2017
13%
Ipsos, 23,537 adults online, June–July 2026
Most counts of politicians' false claims come from fact-checkers, who pick claims that already look doubtful. One study in Italy did something different. It collected every public statement by 86 members of parliament that the four national news agencies reported. A computer program picked out the statements with a fact that can be checked, and the fact-checkers at Pagella Politica rated them.
448 of 2,257 checkable facts were false or half-false. That is 19.8%, shown here as 20 of 100. Italy, 86 members of parliament, 56 weeks of statements between 2019 and 2021. Sources: SRC-MATTOZZI2026
Each belief checked on its own.
Politicians lie all the time
No. Under 1% of 62,918 public statements by Italian members of parliament held a false or half-false fact. Most statements hold no fact that can be checked. But vague statements can still mislead. In the same study, politicians who were fact-checked switched to vaguer statements.
✕FalsePoliticians never do what they promise
No. In 12 countries, parties in government kept 60% of 9,133 promises at least in part. In the UK, it was 86%.
✕FalsePoliticians lie more than the rest of us
We found no study that gave politicians and ordinary people the same honesty test. The Spanish researchers say their mayors lied more than groups tested with similar games in other studies.
?No evidenceFact-checkers show that most of what politicians say is false
No. Fact-checkers pick claims that already look doubtful. In Spain, only 1.69% of the political claims that one fact-checker checked in a year were true, and 22.8% were half true.
✕FalseA fact-check always stops people from voting for a politician who said false things
Not in France or the US. Fact-checks changed what people believed but not how they planned to vote. In Australia, support fell only when false claims outnumbered true ones.
✕FalseSome false claims are honest mistakes, some are lies, and some are true facts used to mislead.
Politicians also get things wrong without meaning to. Stefaan Walgrave and his team asked 488 politicians in Belgium, Canada and Germany what the public thinks. On average, their guesses were 17.6 percentage points off. Ordinary people were 20.9 points off, so only a little worse.
Lies on purpose: Karina Janezic and Aina Gallego asked 816 Spanish mayors to flip a coin in private. Only those who got heads would get a report on the survey results. About 68% said they got heads. If all had told the truth, about 50% would have.
False claims can pay. In France, 2,480 voters in five regions took part in a test before the 2017 election. Some read false or misleading claims by Marine Le Pen. They were 5 percentage points more likely to plan to vote for her, with or without a fact-check. In the US, fact-checks made people believe false claims by Donald Trump less. But his supporters still planned to vote for him.
Spin is the third kind. Researchers at Harvard and Wharton call it paltering: saying true things to give a false picture. In their tests about business deals, the people who were misled judged it as bad as a lie.
Nobody knows. We found no study that gave politicians and ordinary people the same honesty test. The Spanish researchers say their mayors lied more than groups tested with similar games in other studies.
Ordinary people lie too. In a US survey of 1,000 adults, people said they told 1.65 lies a day on average. But 59.9% said they told no lies that day, and 5.3% of people told half of all the lies.
Tests of students who want government jobs point both ways. In India, students who cheated in a dice game were more likely to want a government job. In Denmark, students who wanted to work in government cheated about 9 to 10 percentage points less than others.
Most of them, yes. Robert Thomson and his team studied more than 20,000 promises made before 57 elections in 12 countries. Parties that went on to govern kept 60% of their 9,133 promises at least in part.
A party that rules alone keeps more. In the UK, it was 86%. Parties that share power in a coalition keep fewer, because they have to give things up to their partners.
Counts from other places range from 56% to 87%. François Pétry and Benoît Collette read 18 older studies from Europe and North America. On average, parties kept 67% of their promises. In Australia, a government that ruled without a majority kept 87% of 232 promises at least in part. In Ghana, a policy group counted 57% of 510 promises kept. In Chile, a citizen group counted 56% of the promises that needed a new law.
These counts treat every promise the same. Jonathan Mellon and his team asked UK voters which promises mattered most to them. When they counted the 2017 Conservative promises that way, the share kept fell by 21 percentage points.
Very little, almost everywhere. In an Ipsos survey of 31 countries in 2026, 13% said politicians are trustworthy. That put them last of 22 groups, below doctors at 58%.
Other surveys find the same. In 17 Latin American countries, 15% trust political parties (Latinobarómetro 2026). In 33 countries of the OECD, a group of mostly rich countries,, 26% trust parties and 37% trust their parliament. Only 32% think a politician would say no to a well-paid job offered in return for a favour.
In 39 African countries, 46% trust their president (Afrobarometer 2021 to 2023). And 38% say most or all people in the president's office are corrupt. In Iraq, 21% trust parliament (Arab Barometer 2024). Arab Barometer has reports on seven more Arab countries. We did not add them up, so we have no average for the Middle East.
Part of it is that broken promises count for more in people's minds than kept ones. An international survey asked people in 33 countries in 2006. In 31 of them, more people said members of parliament do not try to keep their promises than said they do.
In Portugal, people were asked about five promises that were all kept at least in part. For each one, about half of them or more said it was not kept. In Ireland, Robert Thomson found that people often judged promises more harshly than the facts gave them reason to. In two tests in Sweden with more than 20,000 people, a broken promise often counted for more than a kept one.
News adds to it. In a study in 17 countries, people's bodies reacted more strongly to bad news than to good news, on average. The authors say this helps explain why news is mostly negative.
Fact-checks add to the picture too. Fact-checkers choose claims that look doubtful, so most of what they publish is false or misleading. Two big US fact-checkers checked the same statement only about 1 time in 10.
And a few politicians say a huge number of false things. The Washington Post counted 30,573 false or misleading claims by Donald Trump in his first four years as president. In Brazil, Aos Fatos counted 6,676 false or distorted statements by Jair Bolsonaro in his four years. Ordinary people are similar: a few tell half of the lies.
Fact-checkers in many countries count how many of the claims they checked were false. These counts tell us about the claims they chose, not about everything politicians say.
In Poland, Demagog found 41.1% of 1,238 checked claims by politicians true in 2022 to 2024. Demagog says it does not pick statements at random. In Brazil, Agência Lupa found 34% of checked claims by politicians fully true. In the Philippines, VERA Files checked and disproved 242 claims by Rodrigo Duterte. 156 of them were false claims, and 71 were cases where he changed his position.
Newtral, a fact-checker in Spain, checked claims by the four biggest parties for one year. Only 1.69% were true, and 22.8% were half true. The researchers who studied this say it shows that Newtral picks doubtful claims well.
Every chart is drawn from the downloadable data.
Ipsos asked 23,537 adults online in 31 countries in June and July 2026. On average 13% said politicians are trustworthy and 61% said they are not. Highest India 31%, lowest Belgium 7%. In 13 countries, including India, the people asked were more urban, richer or had more schooling than the country as a whole.
Sources: SRC-IPSOS2026 · Chart values must match the source register.
| Study | Where | What they counted | What they found |
|---|---|---|---|
| Mattozzi, Nocito & Sobbrio 2026 | Italy | 62,918 public statements by 86 members of parliament | 448 of 2,257 facts false or half-false (19.8%) |
| Thomson et al. 2017 | 12 countries | 9,133 promises by parties that went on to govern, 57 elections | 60% kept at least in part |
| Janezic & Gallego 2020 | Spain | 816 mayors in a private coin-flip game | About 68% said heads; about 50% would if all were honest |
| Walgrave et al. 2023 | Belgium, Canada, Germany | 488 national and regional politicians guessing what the public thinks | 17.6 percentage points off on average (ordinary people 20.9) |
| Barrera et al. 2020 | France | 2,480 voters in a test; some read false or misleading claims by Marine Le Pen | Plan to vote for her went up 5 points, with or without a fact-check |
| Serota, Levine & Boster 2010 | US | 1,000 adults asked about their lies in the last 24 hours | 1.65 lies a day on average, 59.9% told none that day |
Sources: SRC-MATTOZZI2026SRC-THOMSON2017SRC-JG2020SRC-WALGRAVE2023SRC-BARRERA2020SRC-SEROTA2010
The best count of false facts comes from one country, Italy. It comes from one study that other researchers have not yet checked for a journal. It covers middle-rank members of parliament who are often on TV, not party leaders. Fact-checkers can show that a fact is false. But most of the time they cannot show that the politician knew it was false. If studies in other countries, with every statement checked, found far fewer or far more false facts, this verdict would change.
Three cards, each made from this page's data. Settle the argument in the group chat.
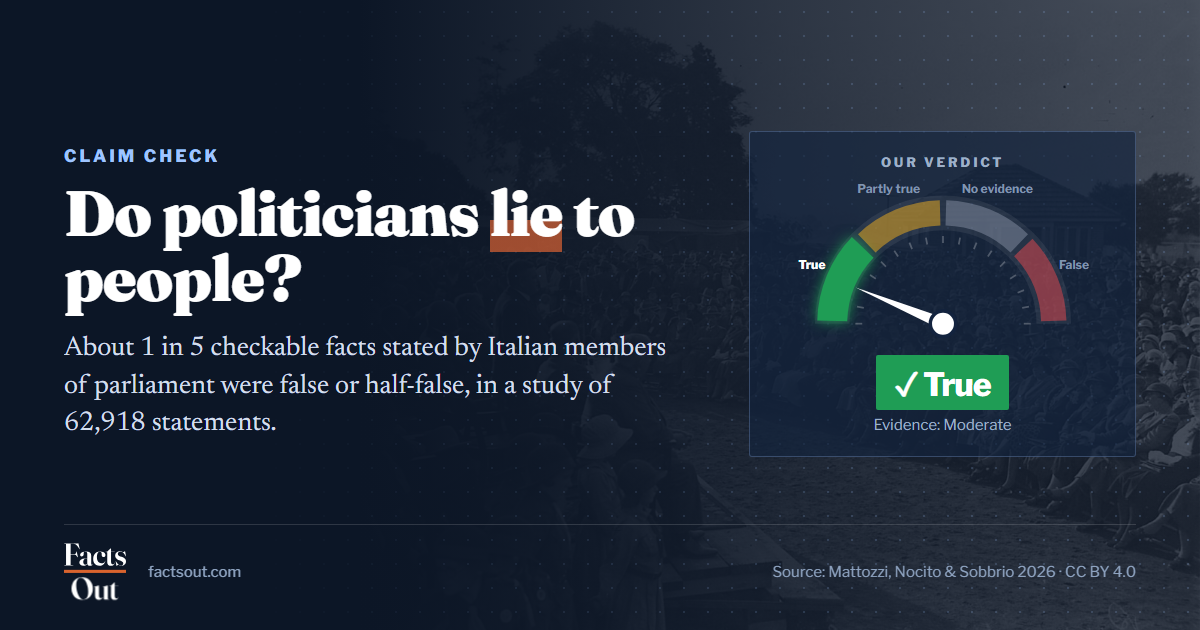
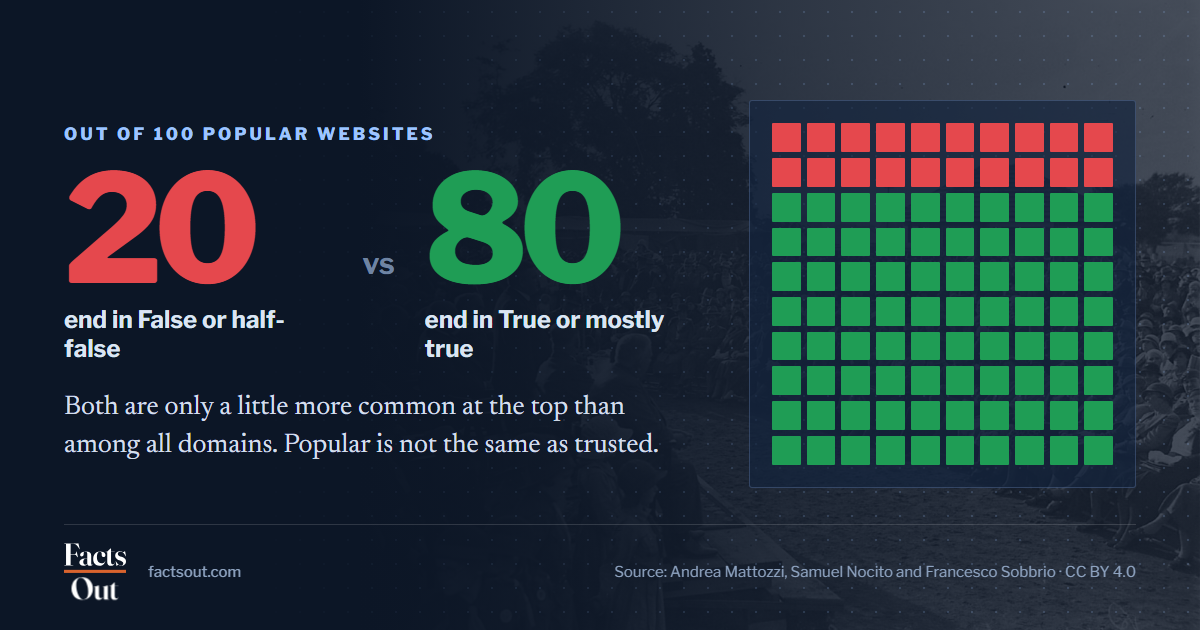
Every number on the cards comes from this page's data. Please credit the source and link here so people can check it.
Need a figure for your own country or a different year? The data is downloadable below, and questions are welcome.
Wording you can copy. Each line says where the number comes from, so your readers can check it.
In Italy, researchers collected 62,918 public statements by 86 members of parliament. 448 of the 2,257 checkable facts in them, or 19.8%, were false or half-false.
Mattozzi, Nocito & Sobbrio, IZA Discussion Paper 18534, 2026
Across 12 countries, parties that went on to govern kept 60% of 9,133 election promises at least in part.
Thomson et al., American Journal of Political Science, 2017
Niskasaari, L. (2026). Do politicians lie to people? What the data says. FactsOut. Retrieved 12 Nov 2026.
Editor · Questions about the data and corrections are welcome.
Reuse and licensing: CC BY 4.0: free to reuse numbers, tables and the card with credit. If you publish online, please link to this page so readers can find the method and sources.
Where the figures come from and what they can and cannot tell us.
We tested the claim that politicians lie to people. We also looked at why they say false things and why so many people believe they lie.
Studies that check what politicians say, honesty tests with politicians and with people who want government jobs, studies of election promises, fact-checker counts and surveys of trust.
On 12 Nov 2026 we searched for studies and counts from Europe, Asia, Latin America, Africa, Oceania, the Middle East and North America. We searched for evidence that politicians lie and for evidence that they lie less than people think.
We read every number in the original study, the authors' own copy or the publisher's page. Where we only saw a summary or a news report, the source list says so.
The only study that collected every reported statement is from Italy. Promise studies cover Europe, North America, Australia, Ghana and Chile. Trust surveys cover every region. For the Middle East we used Iraq and Türkiye. Arab Barometer has trust data for seven more Arab countries that we did not add. We found no study for the Middle East that counts promises or checks every statement, and no study anywhere that gave politicians and ordinary people the same honesty test.
Our calculations: 448 of 2,257 is 19.8%, and 448 of 62,918 is 0.71%. The 60% for promises is 59.55% in the authors' data, rounded. Everything else is shown as the studies report it.
A false fact is not always a lie, because the speaker may not know it is false. Fact-checkers pick doubtful claims, so their counts are not a fair sample. Promise studies count a promise as kept 'at least in part', weigh every promise the same, and their methods differ.
No funding, no ads and no affiliate links on this page. Drafted with AI help. Before publishing, every number is checked against its original source twice.
Two separate checks on 12 Nov 2026 compared every number with its original source. The first changed the wording in about 30 places. The second found the published promise figure (60% of 9,133, not 59% of 8,547) and fixed 12 more places.
Fact-Checking Politicians. IZA Discussion Paper 18534
Statements reported by the four national news agencies. A computer program picked the checkable ones and Pagella Politica rated them. 'False or half-false' = grade 3 or below (half-false, mostly false, utterly false). 19.8% and 0.71% are our calculations from the paper's counts.
Open original sourceThe fulfillment of parties' election pledges: A comparative study on the impact of power sharing. American Journal of Political Science 61(3), 527–542
Published figures from the authors' replication files (Harvard Dataverse doi:10.7910/DVN/YJUIBI, 10 April 2017): parties in government 59.55% of 9,133 pledges fulfilled at least partly, shown as 60%. UK 85.91% of 575. The 31 of 33 countries figure is ISSP 2006 survey data cited in the paper.
Open original sourceMeasuring how political parties keep their promises: A positive perspective from political science. In: Do They Walk Like They Talk? Springer, 65–80
Abstract. The authors say most of the studies they reviewed have weak methods.
Open original sourceEliciting preferences for truth-telling in a survey of politicians. PNAS 117(36), 22002–22008
Full text read in the first check (PMC7486742), including the authors' comparison with other groups tested with similar games. The second check could not open it. The finding that lying mayors were more often re-elected is disputed (Verschuere et al. 2021), so we do not use it.
Open original sourceInaccurate politicians: Elected representatives' estimations of public opinion in four countries. Journal of Politics 85(1), 209–222
Accepted manuscript read in full. 866 politicians were interviewed. The 17.6 average is for 488 politicians in Belgium, Canada and Germany. Swiss politicians were not asked about general public opinion.
Open original sourceFacts, alternative facts, and fact checking in times of post-truth politics. Journal of Public Economics 182, 104123
Read in full.
Open original sourceProcessing political misinformation: Comprehending the Trump phenomenon. Royal Society Open Science 4, 160802
Read in full.
Open original sourceDoes truth matter to voters? The effects of correcting political misinformation in an Australian sample. Royal Society Open Science 5, 180593
Abstract.
Open original sourceArtful paltering: The risks and rewards of using truthful statements to mislead others. Journal of Personality and Social Psychology 112(3), 456–473
Working-paper abstract. DOI confirmed. The tests were about business deals, not politics.
Open original sourceThe prevalence of lying in America: Three studies of self-reported lies. Human Communication Research 36(1), 2–25
Abstract, plus the numbers as the same authors report them in their 2021 paper (doi.org/10.1080/03637751.2021.1985153).
Open original sourceDishonesty and selection into public service: Evidence from India. American Economic Journal: Economic Policy 9(3), 262–290
Working paper read in full, published abstract checked.
Open original sourceSustaining honesty in public service: The role of selection. American Economic Journal: Economic Policy 11(4), 96–123
'About 10 points' is from the 2015 working paper (DP 15-12, 862 students). The AEA's 2019 summary of the published paper gives 9 points. Published text not opened.
Open original sourceThe effects of party identification on perceptions of pledge fulfilment: Evidence from Portugal. International Political Science Review 40(5), 627–642
Accepted version read in full.
Open original sourceCitizens' evaluations of the fulfillment of election pledges: Evidence from Ireland. Journal of Politics 73(1), 187–201
Abstract.
Open original sourceAnd now for a newsflash: politicians actually do keep their promises. The Conversation
The journal article was not opened.
Open original sourceNPP government fulfils 56.77% of 2016 manifesto promises: IMANI
510 promises. Not a peer-reviewed study.
Open original sourceCiudadano Inteligente: gobierno de Bachelet cumplió un 56% de sus promesas del programa
Only promises that needed a new law. Not a peer-reviewed study.
Open original sourceChecking how fact-checkers check. Research & Politics 5(3)
Abstract.
Open original sourceCross-checking journalistic fact-checkers: The role of sampling and scaling in interpreting false and misleading statements. PLOS ONE 18(7), e0289004
Confirms the Washington Post count of 30,573. The Post's own page was blocked for us.
Open original sourceBolsonaro's false or distorted statements, end-of-term count
In Portuguese. 6,676 statements, 4.58 a day.
Open original sourceCzy da się stwierdzić, kto z polityków najczęściej kłamie? Wyjaśniamy
In Polish. 509 of 1,238 statements true.
Open original sourceSó um terço das falas de políticos checadas se mostram verdadeiras, diz estudo
Lupa's own report not opened.
Open original sourceYearender scorecard: six years of fact-checking Duterte
242 statements debunked: 156 false claims and 71 flip-flops.
Open original sourceEstrategias de relaciones públicas frente a la desinformación en el debate político: Análisis de los desórdenes informativos en España. Revista Mediterránea de Comunicación 16(2), e28466
In Spanish. Read in full. True 1.69%, half true 22.78%, 23 Feb 2023 – 23 Feb 2024, PP, PSOE, VOX and SUMAR.
Open original sourceThe Ipsos Global Trustworthiness Index 2026. A 31-country Global Advisor survey
23,537 adults. Samples in 13 countries are more urban, educated or richer than the whole population.
Open original sourceOECD Survey on Drivers of Trust in Public Institutions 2026 Results
Read on the OECD website, chapters 4 and 7. Unweighted OECD averages.
Open original sourceInforme Latinobarómetro 2026
In Spanish. 19,207 interviews.
Open original sourceAfrican Insights 2024: Democracy at risk
53,444 people. Countries weighted equally.
Open original sourceAmid persistent challenges, Iraqis express cautious optimism in latest survey (Arab Barometer Wave VIII, Iraq)
2,408 people.
Open original sourceCross-national evidence of a negativity bias in psychophysiological reactions to news. PNAS 116(38), 18888–18892
Read in full (PMC6754543). The study is about news in general, not about politicians.
Open original sourceAsymmetric accountability: An experimental investigation of biases in evaluations of governments' election pledges. Comparative Political Studies 52(13–14), 2207–2234
Abstract.
Open original sourceNews release: Afrobarometer releases profile on corruption in Africa
Officials in the Presidency, tax officials and civil servants tie at 38% 'most' or 'all' corrupt.
Open original sourceWhich promises actually matter? Election pledge centrality and promissory representation. Political Studies 71(3), 573–596
Abstract on the University of Manchester page: weighting by how central voters find each promise lowers the promise-keeping rate by 21 percentage points.
Open original sourceNew claim page.
CC BY 4.0: free to reuse numbers, tables and the card with credit. If you publish online, please link to this page so readers can find the method and sources.
Niskasaari, L. (2026). Do politicians lie to people? What the data says. FactsOut. Retrieved 12 Nov 2026.