

STAT-001 To verify
86.7% vs 124%of full amount
monthly check if you start at 65 and at 70
People born in 1960 or later · full amount at 67
Our calculation from the rules Original source ↗
Waiting from 65 to 70 makes every check about 43% bigger. We checked the official US life table to see how many people live long enough for that to pay off.
False.
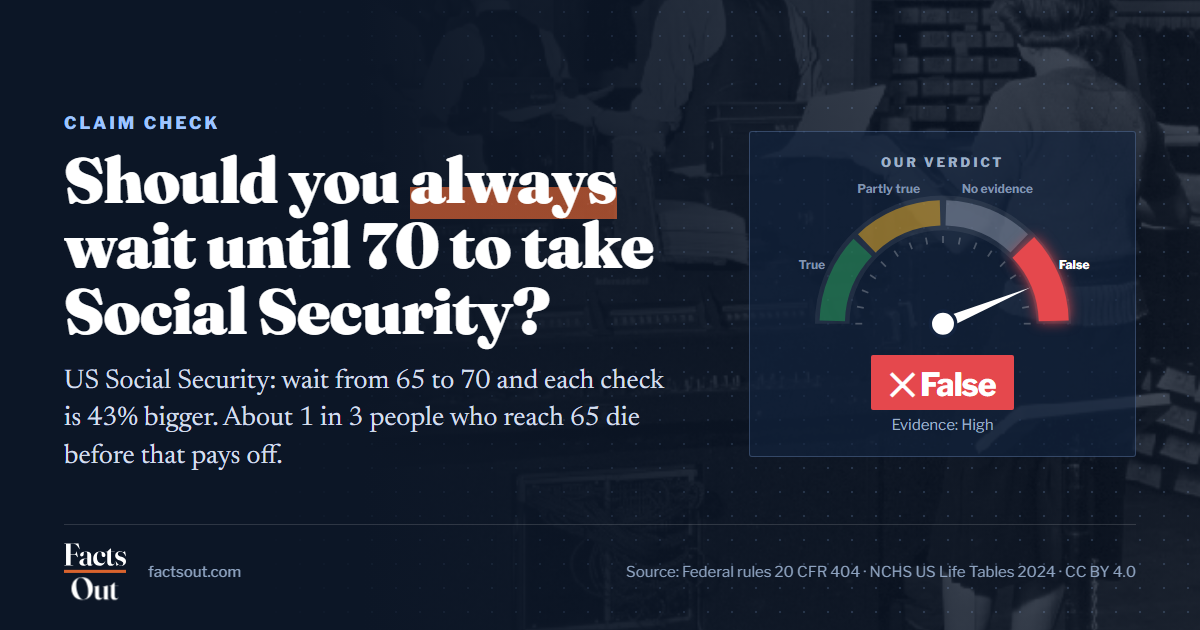
About 1 in 3 Americans who reach 65 die before waiting until 70 pays off. That is our count from the official 2024 US life table. Waiting does give a bigger check: about 43% more each month than at 65.
In short. If you were born in 1960 or later, starting at 65 pays 86.7% of your full amount. Starting at 70 pays 124%, which is about 43% more each month. But you miss five years of checks. In total dollars, the later start only catches up at about age 81½. About 65% of Americans who reach 65 live that long: about 60% of men and 70% of women.
About 43% bigger. You get 124% of your full amount instead of 86.7%, if you were born in 1960 or later. Our calculation from the federal rules. SRC-CFR
Each figure with its source, period and what it measures.
86.7% vs 124%of full amount
People born in 1960 or later · full amount at 67
81.6years
Before taxes and interest
65%of 65-year-olds
United States · life table for 2024
67years
Federal rule 20 CFR 404.409
Each belief checked on its own.
Full retirement age is 65
It is 67 for anyone born in 1960 or later.
✕FalseWaiting past 70 makes the check even bigger
No. The extra stops the month you turn 70.
✕FalseWaiting until 70 always pays off
Only if you live past about 81½. About 1 in 3 people who reach 65 do not.
✕FalseWaiting until 70 gives the biggest monthly check
Yes. 124% of your full amount, the most the rules allow.
✓TrueEvery country pays more if you wait
No. Australia, South Africa and Brazil pay no bonus for waiting alone. Japan pays up to 84% extra, if you wait until 75.
✕FalseThings we found ourselves, with the math shown.
The later start pays more each month but begins five years later. It catches up about 16½ years after 65, after about 11½ years of the bigger checks.
At 65 you get 100% minus 24 months × 5/9 of 1% = 86.667%. At 70 you get 100% plus 36 months × 2/3 of 1% = 124%. The totals are equal after 199.3 months from 65, which is age 81.6. From the 2024 life table, the number alive at 81.6 (counted on a straight line between ages 81 and 82) divided by the number alive at 65: all people 54,548 of 84,133 = 64.8%, men 47,874 of 80,401 = 59.5%, women 61,309 of 87,990 = 69.7%.
No taxes, no interest and no survivor checks in this sum. Our reasoning: the yearly cost-of-living raise grows both choices by the same percentage, so it does not move the catch-up age.
It is 67 for anyone born in 1960 or later. That is the age when you get 100% of your monthly amount.
You can start as early as 62 and get less every month. You can also wait until 70 and get more every month.
The rule starts from 2 January 1960. Someone born on 1 January 1960 has a full retirement age of 66 and 10 months.
It is 86.7% of your full amount, so 13.3% smaller. In most cases the cut stays for the rest of your life.
The rules take 5/9 of 1% off for each month before 67. Two years early is 24 months, so 24 × 5/9 = 13.3%.
The cut gets smaller only if some checks were held back before 67 because you earned too much from work. Then the cut is worked out again at 67.
It is 124% of your full amount. The rules add 2/3 of 1% for each month you wait after 67, and that stops at 70.
Compared with starting at 65, the check at 70 is about 43% bigger. You can check it yourself: 124 divided by 86.7 is 1.43.
At about age 81½. Before that, starting at 65 has paid you more in total. After that, starting at 70 is ahead every month.
Say your full amount at 67 would be $2,000 a month. At 65 you get $1,733 and at 70 you get $2,480. By 81½ both have paid about the same total, and after that the later start is ahead by $747 every month. This is a made-up example, not an average.
If you are married and earn more than your husband or wife, waiting also raises the check they get after you die. So waiting can pay off for a couple even if you die before 81½.
About 65% of Americans who reach 65, by our count from the official 2024 US life table. That is about 60% of men and 70% of women.
A life table starts with 100,000 babies. It shows how many would still be alive at each age if death rates stayed as they were in 2024. We compared the number alive at 65 with the number alive at 81.6.
Many do, but not all. Japan has the biggest increase in our table: 184% of the full amount if you start at 75, against 76% at 60.
The Canada Pension Plan pays 64% at 60 and 142% at 70. Germany and the UK also add to the pension if you wait. Australia, South Africa and Brazil pay no bonus for waiting alone.
We read each rule on the country's own official pension website. For South Korea we found the official rule for waiting but not for starting early. For Mexico, Chile, India and China the official pages were blocked or missing, so they are not in the table.
It depends a lot on where you live. The World Health Organization (WHO) estimates that a 60-year-old in the US can expect 23.3 more years, so to about 83. In Japan and South Korea it is 26.0 more years, and in Nigeria 17.6.
In the WHO's Africa region, a 60-year-old can expect 17.5 more years, and in its South-East Asia region 19.2. In its Europe and Americas regions it is 22.7 years. The world average is 21.2 years.
These are WHO estimates for 2023, and they are averages, not the share of people who reach a given age. Our 65% figure uses the US life table, because the 81½ rule is a US rule.
We also compare countries in another check: is Finland really the happiest country?
No. You can stop working at 65 and start Social Security later, or keep working and start it earlier.
The age you stop working and the age you start your checks are two separate choices.
Every chart is drawn from the downloadable data.
Monthly Social Security check as a share of the full amount at 67, for people born in 1960 or later. 62: 70%, 65: 86.7%, 67: 100%, 70: 124%. Our calculation from the federal rules.
Sources: SRC-CFR · Chart values must match the source register.
| Country | Earliest and full age | Start early | Wait longer |
|---|---|---|---|
| United States | 62 and 67 | 70% at 62 | 124% at 70 |
| Canada (Canada Pension Plan) | 60 and 65 | 64% at 60 | 142% at 70 |
| Japan | 60 and 65 | 76% at 60 | 184% at 75 |
| Germany | 63 (after 35 years in the pension system) and 67 (born 1964 or later) | 0.3% less per month | 0.5% more per month |
| United Kingdom | State Pension age, the same for both | Not allowed | 1% more for every 9 weeks (if you reached pension age after 5 April 2016) |
| South Korea | 60 and 65 (born 1969 or later) | No official figure found | 7.2% more per year, up to 5 years |
| Israel | Retirement age, with an income check. From 70, no income check | No official figure found | 5% more per year, only if work income stopped the pension |
| Australia | Not checked: the official page did not open | Not allowed | No bonus for waiting. The bonus scheme closed to new members in July 2014 |
| South Africa | 60 | Not allowed | No bonus for waiting. A grant only for people with low income and few assets, a little more after 75 |
| Brazil | 62 women, 65 men, after 15 or 20 years of paying in | Not allowed under the main rule (older transition rules exist) | No extra for age alone. Each extra year of paying in adds 2% of your average pay |
Sources: SRC-AUSSRC-BRASRC-CFRSRC-CPPSRC-DRVSRC-ISRSRC-JPNSRC-KORSRC-UKSRC-UK-AGESRC-ZAF
The life table counts deaths in one year, 2024. People who are 65 today will probably live a little longer. So the real share who reach 81½ is probably a little higher. Your own answer can be different. It depends on your health, your other income and how soon you need the money. This page shows the rules and the averages, not advice for you.
Three cards, each made from this page's data. Settle the argument in the group chat.
Every number on the cards comes from this page's data. Please credit the source and link here so people can check it.
Need a figure for your own country or a different year? The data is downloadable below, and questions are welcome.
Wording you can copy. Each line says where the number comes from, so your readers can check it.
About 65% of Americans who reach 65 live past 81.6, the age when waiting until 70 for Social Security has paid more in total than starting at 65, according to a FactsOut calculation from the 2024 US life table.
FactsOut analysis of NCHS United States Life Tables, 2024
Niskasaari, L. (2026). Should you always wait until 70 to take Social Security? FactsOut. Retrieved 12 Nov 2026.
Editor · Questions about the data and corrections are welcome.
Reuse and licensing: CC BY 4.0: free to reuse numbers, tables and the card with credit. If you publish online, please link to this page.
Where the figures come from and what they can and cannot tell us.
We tested the claim that you should always wait until 70 to start Social Security.
US Social Security retirement checks for people born in 1960 or later, compared with the main public pension in 9 other countries. Not survivor, disability or spouse checks.
The federal rules for the size of the check, and the official US life table for how many people live to each age.
We read the rules and the 2024 life table on 12 Nov 2026.
The life table covers the whole US population in 2024.
Share of full amount from the monthly rules. Catch-up age where both choices have paid the same total. Number alive at the catch-up age divided by number alive at 65, straight line between whole ages.
No taxes, interest, survivor checks or health differences. The life table is for one year, so it slightly understates how long people who are 65 today will live.
No funding, no ads and no affiliate links on this page. Drafted with AI help. Every number is checked against its original source before publishing.
Checked twice on 12 and 13 Nov 2026 by two separate agents. Both reopened every number from the original sources and recomputed the calculations from the NCHS spreadsheets and the WHO data. All core numbers matched. Round 1 fixed 10 wordings in the country table. Round 2 added the work-earnings exception to the 'for life' cut, the survivor-check point, and fixed the Israel, Brazil, Germany and Australia rows. ssa.gov blocked both checkers, so the US rules were read from the Cornell LII copy of the federal regulations.
20 CFR 404.310 (earliest age 62), 404.409 (full retirement age), 404.410 and 404.412 (smaller check before it), 404.313 (bigger check after it, also for the survivor)
Read from the Cornell LII copies: https://www.law.cornell.edu/cfr/text/20/404.310 , /404.409 , /404.410 , /404.313 . ecfr.gov and ssa.gov blocked automated requests (403). To be checked on ecfr.gov or ssa.gov in a browser before publishing.
Open original sourceUnited States Life Tables, 2024. National Vital Statistics Reports 75(5)
Tables 1 to 3, number surviving to age x, read from the full PDF. Second check to recompute from Table01.xlsx to Table03.xlsx.
Open original sourceGlobal Health Observatory: life expectancy at age 60 (WHOSIS_000015)
Read from the WHO GHO data service (ghoapi.azureedge.net) on 12 Nov 2026. Saved as suunnitelma/data/who_elinajanodote60_2023.csv. Modelled estimates.
Open original sourceCPP: when to start your pension
Read by a research agent on 12 Nov 2026, with a verbatim quote. Not yet checked by the two review rounds.
Open original sourceDelay (defer) your State Pension
Read by a research agent on 12 Nov 2026, with a verbatim quote. Not yet checked by the two review rounds.
Open original sourceBenefits (English)
Read by a research agent on 12 Nov 2026, with a verbatim quote. Not yet checked by the two review rounds.
Open original sourceOld-age Basic Pension (English)
Read by a research agent on 12 Nov 2026, with a verbatim quote. Not yet checked by the two review rounds.
Open original sourceOld-age pension (English)
Read by a research agent on 12 Nov 2026, with a verbatim quote. Not yet checked by the two review rounds.
Open original sourcePension deferral increment
Read by a research agent and by check round 1 on 12 Nov 2026.
Open original sourcePension Bonus Scheme (operational blueprint)
Read by a research agent on 12 Nov 2026, with a verbatim quote. Not yet checked by the two review rounds.
Open original sourceOlder Person's Grant
Read by a research agent on 12 Nov 2026, with a verbatim quote. Not yet checked by the two review rounds.
Open original sourceConfira as principais mudanças da Nova Previdência
Read by a research agent on 12 Nov 2026, with a verbatim quote. Not yet checked by the two review rounds.
Open original sourceCheck your State Pension age
Quote: 'Your State Pension age is the earliest age you can start receiving your State Pension.'
Open original sourceNew claim page.
CC BY 4.0: free to reuse numbers, tables and the card with credit. If you publish online, please link to this page.
Niskasaari, L. (2026). Should you always wait until 70 to take Social Security? FactsOut. Retrieved 12 Nov 2026.